by Ray Dalio Courtesy Walter Sorochan
Posted February 12, 2014; Updated November 15, 2021.
 The economy is like a machine. At the most fundamental level, it is a relatively simple machine. But many people don’t understand it – or they don’t agree on how it works – and this has led to a lot of needless economic suffering.
The video below is most informative graphic that explains how the economy
works in the world today, including United States and Canada.
The economy is like a machine. At the most fundamental level, it is a relatively simple machine. But many people don’t understand it – or they don’t agree on how it works – and this has led to a lot of needless economic suffering.
The video below is most informative graphic that explains how the economy
works in the world today, including United States and Canada.
Hi-Lites of the video: Discussed are trigger words that affect you and the economy: debt & borrowing; credit, growth, income & spending; inflation vs deflation; depression vs deleveraging; short term vs long term cycles. Video length = 30 mns.
Source: How economy works
To read the entire transcript of Ray Dalio's video presentation, you can Download the Full Paper
Below is an example of an outline and first two pages of this paper: Economic Principles
I. How the Economic Machine Works
II. Debt Cycles: Leveragings & Deleveragings
a) An In-Depth Look at Deleveragings
b) US Deleveraging 1930s
Timeline of Events
c) Weimar Republic Deleveraging 1920s
Timeline of Events
III. Productivity and Structural Reform: Why Countries Succeed &
Fail, and What Should Be Done So Failing Countries Succeed
1. Part 1: The Formula for Economic Success
2. Part 2: Economic Health Indices by Country, and the Prognoses that They Imply
3. Part 3: The Rises and Declines of Economies Over the Last 500 Years
Draft Version
© 2015 Ray Dalio
How the Economic Machine Works
The economy is like a machine. At the most fundamental level it is a relatively simple machine. But many people don’t understand it – or they don’t agree on how it works – and this has led to a lot of needless economic suffering. I feel a deep sense of responsibility to share my simple but practical economic template, and wrote this piece to describe how I believe it works. My description of how the economy works is different from most economists'. It has worked better, allowing me to anticipate the great deleveragings and market changes that most others overlooked. I believe that is because it is more practical. Since I certainly do not want you to blindly believe in my description of how the economic machine works, I have laid it out clearly so that you can assess the value of it yourself. So, let’s begin.
How the Economic Machine Works: “A Transactions-Based Approach”
An economy is simply the sum of the transactions that make it up. A transaction is a simple thing. Because there are a lot of them, the economy looks more complex than it really is. If instead of looking at it from the top down, we look at it from the transaction up, it is much easier to understand.
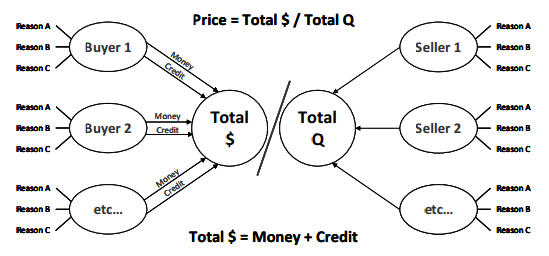
A transaction consists of the buyer giving money (or credit) to a seller and the seller giving a good, a service or a financial asset to the buyer in exchange. A market consists of all the buyers and sellers making exchanges for the same things – e.g., the wheat market consists of different people making different transactions for different reasons over time. An economy consists of all of the transactions in all of its markets. So, while seemingly complex, an economy is really just a zillion simple things working together, which makes it look more complex than it really is.
For any market, or for any economy, if you know the total amount of money (or credit) spent and the total quantity sold, you know everything you need to know to understand it. For example, since the price of any good, service or financial asset equals the total amount spent by buyers (total $) divided by the total quantity sold by sellers (total Q), in order to understand or forecast the price of anything you just need to forecast total $ and total Q. While in any market there are lots of buyers and sellers, and these buyers and sellers have different motivations, the motivations of the most important buyers are usually pretty understandable and adding them up to understand the economy isn’t all that tough if one builds from the transactions up. What I am saying is conveyed in the simple diagram below. This perspective of supply and demand is different from the traditional perspective in which both supply and demand are measured in quantity and the price relationship between them is described in terms of elasticity. This difference has important implications for understanding markets.
The only other important thing to know about this part of the Template is that spending ($) can come in either of two forms – money and credit. For example, when you go to a store to buy something you can pay with either a credit card or cash. If you pay with a credit card you have created credit, which is a promise to deliver money at a later date, [ 1 Credit can be created on the spot between consenting parties. The idea of money going around via "velocity" and adding up to nominal GDP is a misleading description of what happens. ] whereas, if you pay with money, you have no such liability.
In brief, there are different types of markets, different types of buyers and sellers and different ways of paying that make up the economy. For simplicity, I will put them in groups and summarize how the machine works.
Most basically:
• All changes in economic activity and all changes in financial markets’ prices are due to changes in the amounts of 1) money or 2) credit that are spent on them (total $), and the amounts of these items sold (total Q). Changes in the amount of buying (total $) typically have a much bigger impact on changes in economic activity and prices than do changes in the total amount of selling (total Q). That is because there is nothing that’s easier to change than the supply of money and credit (total $).
• For simplicity, let’s cluster the buyers in a few big categories. Buying can come from either 1) the private sector or 2) the government sector. The private sector consists of “households” and businesses that can be either domestic or foreign. The government sector most importantly consists of a) the Federal Government, 2 State and local governments are of course still significant. ] which spends its money on goods and services and b) the central bank, which is the only entity that can create money and, by and large, mostly spends its money on financial assets. Because money and credit, and through them demand, are easier to create (or stop creating) than the production of goods and services and investment assets, we have economic and price cycles.
Seeing the economy and the markets through this ”transactions-based” perspective rather than seeing it through the traditional economic perspective has made all the difference in the world to my understanding of what is going on and what is likely to happen. It lets me see what is actually happening and why it’s happening in much more granular ways than the traditional way of looking at things. I will give you a few examples:
1. The traditional way of looking at the relationship between supply, demand and price measures both supply and demand via the same quantity number (i.e., at any point the demand is equal to the supply which is the amount of quantity exchanged) and the price is described as changing via what is called velocity. There is no attention paid to the total amount of spending that occurred, who spent it, and why they spent it. Yet, in any time and across all time frames, the relationship between the change in the quantities exchanged and the change in the price will change based on these factors that are being ignored. Throwing all buyers into one group (rather distinguishing between them and understanding their motivations) and measuring their demand in terms of quantity bought (rather than in the amount spent) and ignoring whether the spending was paid for via money or credit, creates a theoretical and imprecise picture of the markets and the economy.
2. Most of what economists call the velocity of money is not the velocity of money of money at all – it is credit creation. Velocity is a misleading term created to explain how the amount of spending in a year (GDP) could be paid for by a smaller amount of money. To explain this relationship, people divided the amount of GDP by the amount of money to convey the picture that money is going around at a speed of so many times per year, which is the called the velocity. The economy doesn’t work that way. Instead, much of spending comes from credit creation, and credit creation doesn’t need money to go around in order to occur. Understanding this has big implications for understanding how the economy and markets will work. For example, whereas one who has the traditional perspective might think that a large increase in the amount of money will be inflationary, one using a transactions based approach will understand that it is the amount of spending that changes prices, so that if the increase in the amount of money is offsetting a decrease in the amount of credit, it won’t make a difference; in fact, if the amount of credit is contracting and the amount of money is not increased, the amount of spending will decline and prices will fall.
This different way of looking at the economy and markets has allowed us to understand and anticipate economic booms and busts that others using more traditional approaches have missed.
How the Market-Based System Works
As mentioned, the previously outlined economic players buy and sell both 1) goods and services and 2) financial assets, and they can pay for them with either 1) money or 2) credit. In a market-based system, this exchange takes place through free choice – i.e., there are “free markets” in which buyers and sellers of goods, services and financial assets make their transactions in pursuit of their own interests. The production and purchases of financial assets (i.e., lending and investing) is called “capital formation”. It occurs because both the buyer and seller of these financial assets believe that the transaction is good for them. Those with money and credit provide it to recipients in exchange for the recipients’ “promises” to pay them more. So, for this process to work well, there must be large numbers of capable providers of capital (i.e., investors/lenders) who choose to give money and credit to large numbers of capable recipients of capital (borrowers and sellers of equity) in exchange for the recipients’ believable claims that they will return amounts of money and credit that are worth more than they were given. While the amount of money in existence is controlled by central banks, the amount of credit in existence can be created out of thin air – i.e., any two willing parties can agree to do a transaction on credit – though this is influenced by central bank policies. In bubbles more credit is created than can be later paid back, which creates busts.
When capital contractions occur, economic contractions also occur, i.e., there is not enough money and/or credit spent on goods, services and financial assets. These contractions typically occur for two reasons, which are most commonly known as recessions (which are contractions within a short-term debt cycle) and depressions (which are contractions within deleveragings). Recessions are typically well understood because they happen often and most of us have experienced them, whereas depressions and deleveragings are typically poorly understood because they happen infrequently and are not widely experienced.
A short-term debt cycle, (which is commonly called the business cycle), arises from a) the rate of growth in spending (i.e., total $ funded by the rates of growth in money and credit) being faster than the rate of growth in the capacity to produce (i.e., total Q) leading to price (P) increases until b) the rate of growth in spending is curtailed by tight money and credit, at which time a recession occurs. In other words, a recession is an economic contraction that is due to a contraction in private sector debt growth arising from tight central bank policy (usually to fight inflation), which ends when the central bank eases. Recessions end when central banks lower interest rates to stimulate demand for goods and services and the credit growth that finances these purchases, because lower interest rates 1) reduce debt service costs; 2) lower monthly payments (de-facto, the costs) of items bought on credit, which stimulates the demand for them; and 3) raise the prices of income-producing assets like stocks, bonds and real estate through the present value effect of discounting their expected cash flows at the lower interest rates, producing a “wealth effect” on spending.
In contrast:
A long-term debt cycle, arises from debts rising faster than both incomes and money until this can’t continue because debt service costs become excessive, typically because interest rates can’t be reduced any more. A deleveraging is the process of reducing debt burdens (i.e., debt and debt service relative to incomes). Deleveragings typically end via a mix of 1) debt reduction,[ 3 3 Debt reductions take the form of some mix of debt write-downs (so the amount of debt to be repaid is reduced), the timing of debt payments being extended and interest rates being reduced. ] 2) austerity, 3) redistributions of wealth, and 4) debt monetization. A depression is the economic contraction phase of a deleveraging. It occurs because the contraction in private sector debt cannot be rectified by the central bank lowering the cost of money. In depressions, a) a large number of debtors have obligations to deliver more money than they have to meet their obligations, and b) monetary policy is ineffective in reducing debt service costs and stimulating credit growth. Typically, monetary policy is ineffective in stimulating credit growth either because interest rates can’t be lowered (because interest rates are near 0%) to the point of favorably influencing the economics of spending and capital formation (this produces deflationary deleveragings), or because money growth goes into the purchase of inflation-hedge assets rather than into credit growth, which produces inflationary deleveragings. Depressions are typically ended by central banks printing money to monetize debt in amounts that offset the deflationary depression effects of debt reductions and austerity.
To be clear, while depressions are the contraction phase of a deleveraging, deleveragings (e.g., reducing debt burdens) can occur without depressions if they are well managed. (See ”An In-Depth Look at Deleveragings.“) Differences in how governments behave in recessions and deleveragings are good clues that signal which one is happening. For example, in deleveragings, central banks typically ”print“ money that they use to buy large quantities of financial assets in order to compensate for the decline in private sector credit, while these actions are unheard of in recessions.[ 4 These show up in changes on their balance sheets that don’t occur in recessions. ] Also, in deleveragings, central governments typically spend much, much more to make up for the fall in private sector spending.
But let‘s not get ahead of ourselves. These two types of contractions are just parts of two different types of cycles that are explained more completely in the download paper.