By Tyler Durden [ facilitated by Walter Sorochan ]
Posted November 01, 2012; Update October 2021.
We live in a rapidly changing world compared to that of 150 to 300 years ago. We felt the very rapid pandemic change of 2020. This article, written in 2012, attempts to explain why most of us have difficulty understanding the impact that rapid change has on all of us.
 For centuries we have been living in a
linear world; that is, there was continuous growth with very little if any
change, like in a straight line.
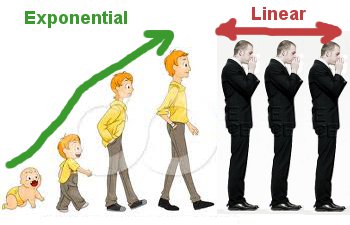
This is illustrated in the height growth diagram on the left by the men in
black. Once a man reaches maturity, his size remains the same or linear.
Conversely, a child continues to increase in size over time and this is referred
to as exponential growth.
For centuries we have been living in a
linear world; that is, there was continuous growth with very little if any
change, like in a straight line.
This is illustrated in the height growth diagram on the left by the men in
black. Once a man reaches maturity, his size remains the same or linear.
Conversely, a child continues to increase in size over time and this is referred
to as exponential growth.
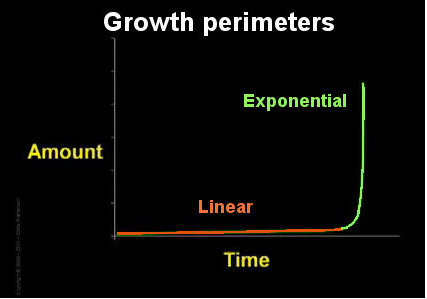
Below are examples of linear verses exponential growth: The first graph on the left helps us become aware that growth curves are based on time [years] and amount and can be expressed as linear or exponential.
|
 |
 |
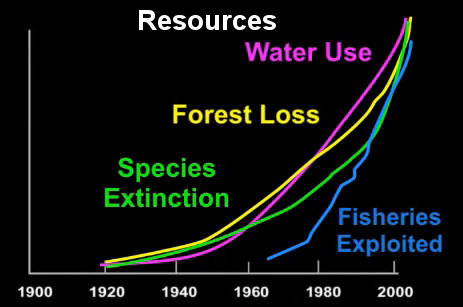 |
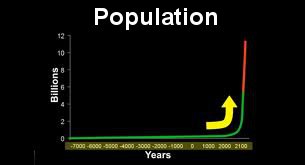
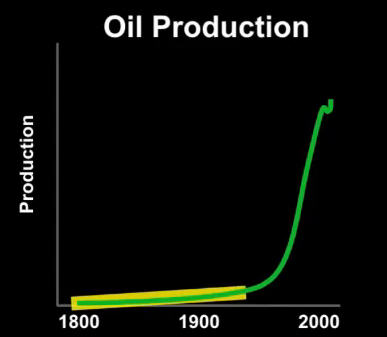
| Amount over Time | Population growth | Oil production | Resources limit |
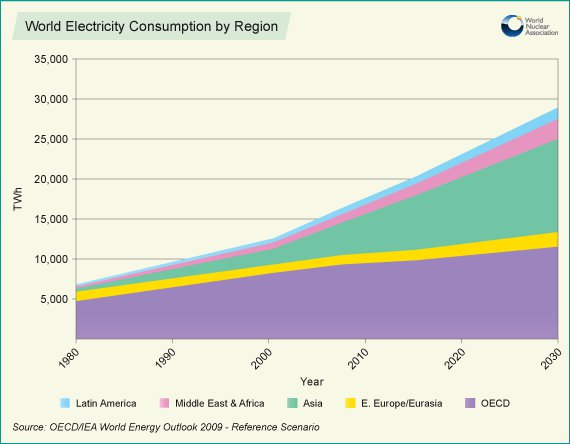
Each of these examples have similar patterns. Each has a horizontal constant growth for many years [ linear growth ] and then sudden vertical upward growth [ exponential ]. It is obvious that continuity of population, economy and energy growth, are dependent on availability of resources. Growth has limits.
Chris Martenson Martenson: Chapter 5 focuses on three E's: economy, energy and environment; that these are interrelated and cannot be solved in isolation. These three are linked by exponential growth. The connection between all three is subtle and invisible but powerful.
|
"The greatest shortcoming of the human race is our inability to understand the exponential function." Dr. Albert Bartlett Martenson: Chapter 3 & 4 |
Growth, surplus and prosperity: For the past 300 years we have been lulled into thinking that growth gives us prosperity. But today, growth may give us a surplus but not necessarily prosperity. For example, it has been calculated that more than half of the world's energy supply is now used to just grow. This means that, for example, it costs more to find and get the oil out of the ground that it does to make it useful .... a losing proposition. Martenson: Chapter 5
Chris Martenson focuses on "Why The Next 20 Years Will Be Marked By The Collapse Of The Exponential Function."
We face a different world in the next 20 years. Today we live in an extraordinary time that is unfolding before us that is confusing, invisible and silent. The trends are unfixable because there is no way for us to return to normal or to the "good old days!" The way things worked in the old days are no longer possible.
In the video courtesy of GoldMoney, Chris Martenson, economic analyst at chrismartenson.com and author of ‘The Crash Course’, explains why he thinks that the coming 20 years are going to look completely unlike the last 20 years:
Martenson: why-next-20-years-will-be-different 2011
 In his
presentation he focuses on the so-called three “Es”: Economy, Energy and
Environment. He argues that at this point in time it is no longer
possible to view either one of those topics separately from one another.
In his
presentation he focuses on the so-called three “Es”: Economy, Energy and
Environment. He argues that at this point in time it is no longer
possible to view either one of those topics separately from one another.
Since all our money is loaned onto existence, our economy has to grow exponentially. Martenson proves this point empirically by showing a 99.9% fit of the actual growth curve of the last 40 years to an exponential curve. If we wanted to continue on this path, our debt load would have to double again over the next 10 years. By continually increasing our debt relative to GDP we are making the assumption that our future will always be wealthier than our past. He believes that this assumption is flawed and that the debt loads are already unmanageable.
Martenson explains how exponential growth works and why it is so scary that our economy is based on it. In an example he illustrates how unimaginably fast things speed up toward the end of an exponential curve. He shows that an exponential chart can be found in every one of the three “E’s” for instance in GDP growth, oil production, water use or species extinction. Due to the natural limitations on resources, Martenson comes to the conclusion that we are facing a serious energy crisis.
This energy predicament is namely that the quantity of oil as well as the quality of oil are in decline. He shows that oil discoveries peaked in 1964 and oil production peaked 40 years later. Martenson also shows how our return on invested energy is rapidly declining – the “cheap and easy” oil fields have already been exploited. In 1930 the energy return for oil was 100:1 or greater. Today it is already down to 3:1 and newer technologies such as corn-based ethanol only provide a 1.5:1 return. Martenson predicts that the time in between oil shocks will get shorter and shorter and that oil prices will go much higher.
Not only oil but also other natural resources are being rapidly used up as well. At the current projected pace of use, known reserves for many metals and minerals will be gone within the next 10 to 20 years. The energy needed to get these non-renewable resources out of the ground is growing exponentially. So we live in a world that must grow, but can’t grow and is subject to depletion. The conclusion out of all this is that our money system is poorly designed and that we need to rethink how we do things as quickly as possible. Our monetary system is badly out of step with reality.
After finishing his presentation Chris Martenson answers questions regarding a rise in efficiency, alternative technologies and oil prices. He also responds to questions regarding electricity, shale gas, gold, silver, platinum, palladium, and uranium and the race for global resources.
References:
Camoin Rob, "Three Things You Can Do to Help Your Region Transition to a New Economic Era," Canoin Associates, August 2012. Camoin: new econ era
Durden Tyler, "Chris Martenson Lecture On Why The Next 20 Years Will Be Marked By The Collapse Of The Exponential Function," November 29, 2011. The Crash Course Martenson: why-next-20-years-will-be-marked-collapse-exponential-function 2011
Edwards Lin, "Humans will be extinct in 100 years says eminent scientist," Phys Org, June 23, 2010. Edwards: pop Growth
Ferguson Michael, The Third Millennium Project, The American Polymathic Institute, 2001. Ferguson: Millennium Project
History of world in 7 minutes, Jun 26, 2010. World history in 7 mns
Martenson Chris, " Problem or Predicament," --The Crash Course The Eco-friendly Blog, November 23, 2011. Martenson: crash course 2011
Martinson: Chris, "The Crash Course Part 1," Nov 24, 2010 Martinson: Introd crash course 2010
Martenson Chris, "The Power of Compounding," Crash Course: Ch. 3 & 4 Martenson: Chapter 3 & 4
Martenson Chris, "Growth vs. Prosperity," Crash Course: Chapter 5. Martenson: Chapter 5
Nemethy Les, "The power of compound interest as applied to the current debt crisis," Warsaw Business Journal, October 26, 2012.
article no longer active.
"A similar chart could be drawn for most of the developed world. Indeed, growth of money supply in many developed countries has also been exponential.
Note that from 1970 to 2008, there is an almost perfect match between US debt and an exponential growth curve. Then in 2008, debt leveled off – see the squiggle at the end of the red line. You might say that the recession we are now feeling is caused by or correlated with cessation of credit growth (e.g. the removal of the steroid). We are experiencing withdrawal symptoms."
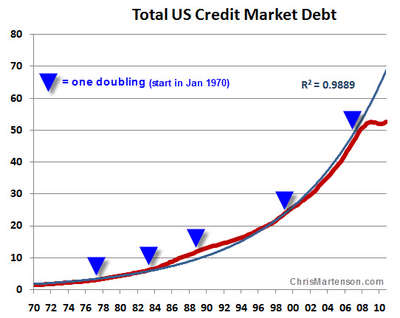
"In the graph above, the blue curve shows a perfect exponential curve, the red curve shows the actual level of US debt (in trillions of dollars)."
Wikipedia, "World population estimates." May 16, 2012. Wiki: world pop estimates
World Energy Needs and Nuclear Power, "World electric consumption by region." World Nuclear Association, September, 2012. World Energy Needs